
How to Calculate Investment Returns: Expert Tips
How to Calculate Investment Returns: Expert Tips
Discover how to calculate investment returns using proven formulas and expert tips. Boost your portfolio performance today!


Domingo Valadez
Mar 1, 2025
Blog
Understanding Investment Returns: A Deeper Dive

Calculating investment returns is more than just number crunching. It's about understanding what those numbers mean for your financial goals. This starts with grasping key concepts. Absolute return measures the simple percentage increase or decrease in your investment's value.
Relative return, on the other hand, compares your investment's performance against a benchmark like the S&P 500. This comparison reveals whether you are outperforming or underperforming the market.
It's also important to understand the difference between nominal returns and real returns. Nominal returns don't account for inflation. Real returns factor in inflation's impact on purchasing power, offering a more accurate view of your investment's growth. A 5% nominal return with 3% inflation means a real return of approximately 2%.
Historical Performance and Portfolio Diversification
Understanding historical performance is crucial for portfolio diversification. In 1945, the S&P Composite Index returned 35.82%, while long-term government bonds returned about 3.80%. This difference underscores the importance of diversifying your investments.
Investors often use the compound annual growth rate (CAGR) to understand investment growth over time. If an investment grows from $100 to $150 over three years, the CAGR is about 14.47%. This calculation helps assess the effectiveness of investment strategies. Learn more about historical returns here.
Factors Influencing Returns
Market conditions and economic forces significantly influence investment returns. Understanding these external factors is as important as knowing how to calculate returns. An economic downturn, for example, can impact even the most well-planned investments.
The Importance of Benchmarks
Comparing your investment performance against suitable benchmarks gives valuable context. This helps evaluate your strategy's effectiveness relative to similar investments. This comparison can highlight areas for improvement and guide adjustments to your investment approach.
Master The Essential Formulas That Actually Work

Understanding investment returns starts with knowing the core formulas. These calculations are essential for making informed decisions, whether you're looking at short-term gains or employing more complex, long-term strategies.
Simple Percentage Return
The Simple Percentage Return is a straightforward way to calculate returns on short-term investments. The formula is: ((Current Value - Initial Value) / Initial Value) * 100.
For example, if your initial investment of $1,000 grows to $1,100, your return is 10%. While this quickly illustrates basic growth, it doesn't factor in the holding period or the effect of reinvesting dividends.
Total Return
Total Return gives a more complete view by including dividends and interest earned. The calculation is: ((Current Value + Dividends/Interest - Initial Value) / Initial Value) * 100.
If your $1,000 investment also earned $50 in dividends, your total return becomes 15%. This highlights how dividends contribute significantly to overall returns. Reinvesting these gains, even if seemingly small, is crucial for long-term success. Learn more about maximizing returns in our article about how to master real estate syndication investor returns.
Compound Annual Growth Rate (CAGR)
The Compound Annual Growth Rate (CAGR) measures the average annual growth of an investment over time, accounting for the powerful effect of compounding. This metric is essential when evaluating long-term investments.
Time-Weighted Return (TWR)
Time-Weighted Return (TWR) focuses solely on investment performance. By eliminating the influence of cash flows (deposits and withdrawals), it offers a clearer view of how well your investments are managed, irrespective of timing or amount. This is a key metric used by fund managers.
Internal Rate of Return (IRR)
Internal Rate of Return (IRR) is a more complex calculation that considers both the timing and size of all cash flows – both inflows and outflows. This makes it ideal for investments with variable cash flows, such as real estate projects or real estate syndications. For more on this, see: How to master real estate syndication investor returns.
Choosing The Right Formula
Each formula has its specific use cases and limitations. Choosing the right formula is critical for accurately assessing investment performance. The following table provides a comparison to help you select the most appropriate method.
Investment Return Calculation Formulas: A comparison of different formulas used to calculate investment returns, their applications, advantages, and limitations.
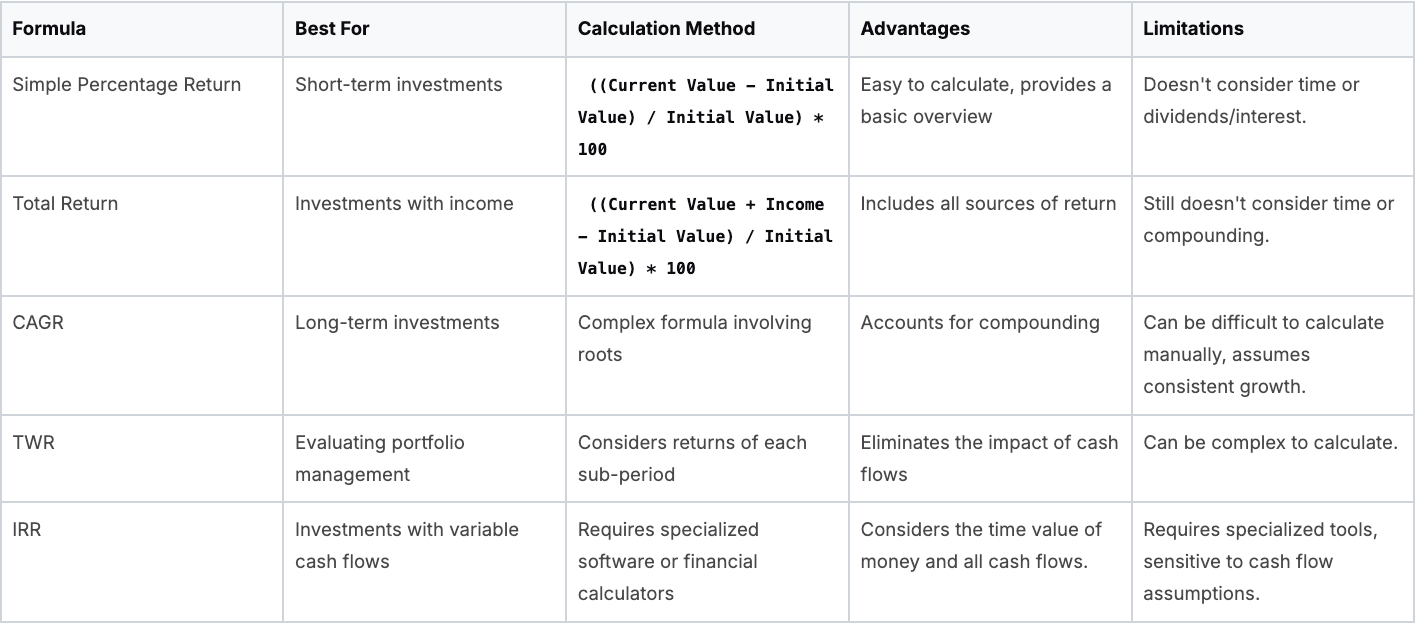
Understanding these formulas and their applications is essential for accurately evaluating investment returns. By mastering these calculations, you'll be better equipped to make informed decisions and confidently pursue your financial objectives.
How Economic Forces Transform Your Return Calculations

Calculating investment returns involves more than simply plugging numbers into formulas. It requires a deeper understanding of how larger economic forces can significantly alter the results. This means going beyond basic percentage gains and considering the real impact of inflation, interest rates, and taxes.
Inflation's Impact on Real Returns
Inflation steadily diminishes the purchasing power of investment returns. A 10% annual return may appear substantial, but with 4% inflation, the real return is closer to 6%. This difference highlights that while the investment grows numerically, its ability to purchase goods and services doesn't increase by the full 10%. Calculating inflation-adjusted returns is vital for a clear picture of true investment growth.
Interest Rate Fluctuations and Calculation Methods
Changes in interest rates directly influence investment returns and the methods used to calculate them. Rising interest rates can boost bond yields, while falling rates might increase bond prices. This volatility necessitates adjustments to calculations to accurately reflect the economic climate. For instance, discount rates in present value calculations need to be aligned with current interest rates.
The Role of Taxes
Taxes play a substantial role in the disparity between nominal returns and the actual amount investors retain. Two identical investments with varying tax treatments can produce considerably different after-tax returns. Tax-advantaged accounts, such as Roth IRAs, offer tax-free withdrawals, thereby enhancing the real return compared to taxable investments. Factoring in tax implications is crucial for informed investment decisions.
The Laffer Curve and Investment Decisions
Understanding broader economic principles provides valuable context. The Laffer Curve, while primarily concerned with tax revenues, demonstrates how economic factors like tax rates influence investment choices. High tax rates could steer investors toward tax-efficient investments, impacting overall market returns. Calculating returns in these scenarios requires considering such external influences. Explore this concept further here.
Adapting to Economic Conditions
Analyzing market cycles and economic indicators allows for more strategic portfolio adjustments. This deeper understanding enables proactive responses to economic shifts, rather than simply reacting to superficial performance figures. Ultimately, incorporating economic factors into return calculations facilitates a more realistic and effective investment strategy.
Avoiding the Return Calculation Mistakes That Cost Investors

Accurately calculating investment returns is essential for informed financial decisions. However, many investors, even experienced ones, make common mistakes that can significantly impact their understanding of their portfolio's performance. These errors can lead to poor investment choices and hinder long-term financial goals.
Overlooking Fees and Expenses
One of the most common mistakes is forgetting about fees and expenses. While these costs might seem small initially, they can compound over time and significantly reduce your overall returns. For example, a 1% annual fee on a $100,000 investment adds up to over $20,000 over 20 years. This illustrates the importance of carefully considering expense ratios and other fees when selecting investments.
Mishandling Cash Flows
Properly accounting for cash flows—both money coming in and going out—is crucial for accurate return calculations. Neglecting to include dividends, interest payments, or withdrawals can give you a skewed view of your actual performance. If you add more money to an investment, simply looking at the percentage increase in value doesn't tell the whole story. Instead, using the time-weighted return method, which accounts for cash flows, offers a more accurate picture.
Ignoring Reinvestment of Dividends
Failing to reinvest dividends can also lead to underestimating total returns. Dividends, while seemingly small individually, play a crucial role in long-term growth thanks to the power of compounding. Reinvesting dividends allows you to buy more shares, which generate more dividends, creating a cycle of growth. Not including this in your calculations can significantly underestimate your actual returns.
Psychological Traps and Verification
Calculation errors can create psychological traps, causing investors to misinterpret their performance and make emotionally driven decisions based on inaccurate information. To avoid this, establishing reliable verification methods is crucial. Regularly comparing your calculated returns against your brokerage statements or using independent portfolio tracking tools like Personal Capital can help ensure accuracy and build confidence in your analysis.
Practical Solutions for Accurate Calculations
Avoiding these mistakes requires careful attention to detail and consistent calculation methods. The following table summarizes common errors, their impact, and practical solutions to ensure accuracy.
Top Return Calculation Mistakes and Solutions A comprehensive list of common errors investors make when calculating returns and how to avoid them
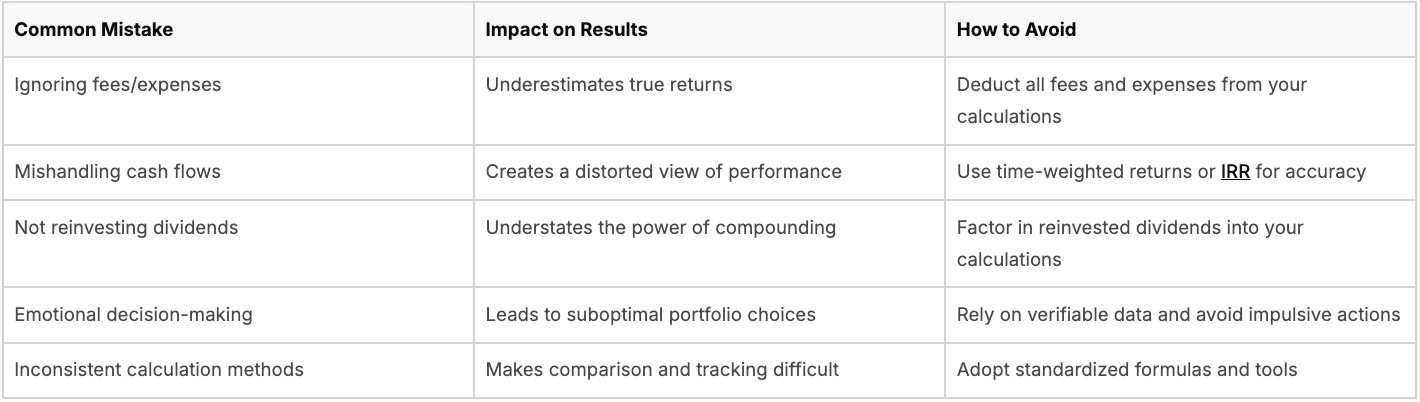
By understanding and avoiding these common pitfalls, investors can develop a more realistic view of their investment performance. This understanding empowers them to make informed decisions aligned with their financial goals.
Calculating Investment Returns With Digital Tools
Accurately calculating investment returns is essential for understanding your portfolio's performance and making informed decisions. Fortunately, several digital tools can simplify this process, providing valuable insights and helping you achieve your financial goals. These tools range from comprehensive portfolio management platforms to flexible spreadsheet templates.
Portfolio Management Platforms: A Centralized Approach
Portfolio management platforms offer a centralized hub for all your investment information. They often include features like automatic data updates, asset allocation analysis, and detailed performance reports. This can be especially helpful for managing more complex portfolios.
- Personal Capital: Personal Capital is a free platform that provides a holistic overview of your financial life, connecting to all your accounts. It tracks investment returns, analyzes asset allocation, and even offers financial planning tools.
- SigFig: SigFig offers similar free portfolio tracking and analysis, along with investment advice and suggestions for potential improvements.
- Morningstar Portfolio Manager: Designed for more active investors, Morningstar Portfolio Manager allows for in-depth analysis and research, including detailed reports on individual investments and performance benchmarking.
Spreadsheet Templates: A Hands-On Approach
Spreadsheet templates provide a customizable way to calculate investment returns for those who prefer a more hands-on approach. Numerous pre-built templates are available online, or you can create your own using programs like Google Sheets or Microsoft Excel.
Using spreadsheets, you can:
- Track Individual Investments: Input the initial investment, purchase date, current value, dividends, and interest received to calculate returns for each holding.
- Calculate Total Portfolio Return: Combine the returns of your individual investments to determine your overall portfolio performance.
- Perform What-If Analysis: Experiment with different investment scenarios and analyze their potential impact on your returns.
Selecting the Right Tool for Your Needs
The ideal tool depends on your individual needs and preferences. Consider factors such as:
- Portfolio Complexity: A simple portfolio might only require a spreadsheet template, while a more complex one might benefit from a platform's automation.
- Desired Control Level: Spreadsheets offer more control over calculations and data presentation, while platforms handle much of the work automatically.
- Cost: Many platforms are free, while some offer premium features for a fee. Spreadsheet templates are generally free to use.
Accurate Configuration and Avoiding Pitfalls
Regardless of your chosen tool, accurate configuration is crucial to avoid common pitfalls:
- Data Entry Accuracy: Double-check all inputs, including initial investment amounts, dates, and current values. Errors can significantly skew calculations.
- Consistent Methodology: Maintaining a consistent calculation method across all investments ensures accurate comparisons.
- Fee and Expense Consideration: Account for fees and expenses, as they can significantly impact overall returns.
Using Return Analysis for Future Planning
By leveraging these digital tools and adhering to best practices, you can develop a more comprehensive understanding of your investment returns. This knowledge empowers you to make informed decisions and strategically plan for the future. Spotting performance trends, adjusting your portfolio accordingly, and maintaining consistent calculations are all advantages of utilizing these tools. This proactive approach allows you to make informed decisions, rather than simply reacting to market fluctuations. Remember, calculating returns isn't just about understanding the past; it's about strategically shaping your financial future.
Advanced Metrics: Unlocking True Portfolio Performance
We've covered the basics of calculating investment returns and the economic forces that shape them. But to truly grasp your portfolio's performance, we need to explore more sophisticated metrics. These go beyond simple percentage gains, providing a deeper understanding of the relationship between risk and return.
Risk-Adjusted Returns: Evaluating Performance Against Risk
Risk-adjusted return metrics assess the return you receive relative to the risk undertaken. These are essential when comparing investments with varying risk profiles. Two key metrics are the Sharpe Ratio and the Sortino Ratio.
- Sharpe Ratio: This ratio measures excess return per unit of total risk. It's calculated by subtracting the risk-free rate of return (such as a U.S. Treasury bill) from your investment's return, then dividing by the investment's standard deviation. A higher Sharpe Ratio typically signifies better risk-adjusted performance.
- Sortino Ratio: Similar to the Sharpe Ratio, the Sortino Ratio also measures excess return per unit of risk. However, it focuses on downside risk, utilizing downside deviation instead of standard deviation. This makes it more suitable for analyzing investments with potentially uneven return distributions.
Capture Ratios: Revealing Portfolio Strengths and Weaknesses
Capture ratios benchmark your portfolio's performance during both rising and falling markets. This reveals how your strategy performs under different market conditions. The two primary capture ratios are:
- Upside Capture Ratio: This measures your portfolio's performance against the benchmark during periods of market growth. A ratio above 100 suggests your portfolio outperformed the benchmark in up markets.
- Downside Capture Ratio: This indicates your portfolio's performance relative to the benchmark during market declines. A ratio below 100 implies your portfolio lost less than the benchmark in down markets.
Drawdown Analysis: Measuring Your Risk Tolerance
Drawdown represents the peak-to-trough decline within a specific timeframe. Drawdown analysis helps you understand potential losses and your comfort level with market fluctuations. Maximum drawdown, for example, measures the greatest percentage drop from a peak to a subsequent trough. This is crucial for understanding your true risk tolerance and preventing emotional decisions during market downturns.
Attribution Analysis: Pinpointing Performance Drivers
Attribution analysis identifies the specific investment choices driving your portfolio's performance. It determines whether returns are mainly due to sector allocation, stock selection, or other factors. This understanding allows you to refine your strategy and make informed decisions. For instance, if sector allocation is the primary driver, you might adjust allocations to capitalize on emerging trends.
By understanding these advanced metrics, you gain a more nuanced view of investment returns. This empowers data-driven decisions, more effective risk management, and a refined strategy for long-term success. Visit Homebase to learn how their platform can simplify real estate syndication and offer deeper investment performance insights.
Share On Linkedin
Share On Twitter
Share On Linkedin
Share On Twitter
DOMINGO VALADEZ is the co-founder at Homebase and a former product strategy manager at Google.
What To Read Next


How Zach Bagby and Courtney Erickson Built a $5M Real Estate Portfolio While Full Time in Tech
Podcast
The fifty-sixth episode of Groundbreakers Podcast by Homebase! Listen in for an amazing interview with Zach Bagby and Courtney Erickson, co-founders of ZB3 Real Estat


Sign up for the newsletter
If you want relevant updates from our team at Homebase, sign up! Your email is never shared.
Sign up for the newsletter
If you want relevant updates from our team at Homebase, sign up! Your email is never shared.


